Dashboards and Views
Dashboards and Views
One of the main uses of reports in OrderFlow is in the creation of dashboards. Dashboards are based on snippets of read-only information, called fragments, which aim to provide, in a very accessible and visual way, access to key items of information on the system. Unlike regular reports, dashboards are highly visible to users.
For example, a dashboard can provide information about courier selections and despatch delivery choices. In that case there would be fragments that display:
- shipments, packed at the day of viewing (essentially - today) - grouped by carrier
- outstanding shipments - grouped by carrier
- outstanding shipments - grouped by courier state
- outstanding shipments - grouped by destination country.
A custom dashboard fragment can be added, for instance, to display all shipments for the past month (grouped by courier) in the form of a graph. Alternatively, a new dashboard screen can be created to contain specific information relating to a particular courier.
New dashboard screens, similarly to reports, can be added by:
- creating a new dashboard screen from scratch. This usually requires the most effort.
- cloning an existing dashboard - either a built-in or a custom screen.
- overriding a built-in dashboard screen. Essentially, this does not create a new dashboard, but rather modifies an existing one.
Existing dashboard screens can be edited, for example, by adding or removing fragments. Indeed, the system supports the creation of entirely new screens, which can be attached to menus (both new and existing), allowing for a highly customised view of data on the system without any development effort.
New or updated dashboard screens can be attached to existing or new menu entries. This greatly increases the capability that OrderFlow customers have to increase visibility of specific areas of the system that are important to their businesses.
An example of one of the dashboard fragments mentioned above is shown next:
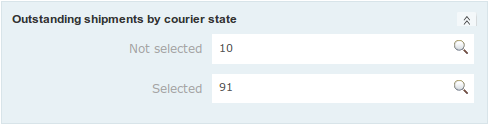
This fragment displays all outstanding shipments, grouped by courier state. If there are none, it displays an information message, stating that there are no outstanding shipments on the system.
OrderFlow's dashboard management framework goes further by supporting the modification of dashboard fragments. Dashboard fragments are based on reports on the system. As with other reports, administrators have the tools at their disposal for overriding, cloning, exporting/importing or modifying dashboard fragments. More information on creating new reports can be found in the Report Administration section of the previous chapter.
OrderFlow support staff can be commissioned to perform these modifications. Alternatively, customer IT staff can be trained - with with a little help from this document - to do the same without the direct involvement of OrderFlow.
Dashboard Report Fragments
In order to configure dashboard fragments, it is worth familiarising yourself with the Custom Reports on the system. For authoring dashboard fragments and screens, the following additional skills are required:
- familiarity using HTML.
- knowledge of how to use the FreeMarker templating engine, which can be easily acquired from the FreeMarker web site.
Editing Existing Dashboards
To configure the report design, navigate to the Fragment Configuration page from OrderFlow by clicking on the Reports tab, then Dashboards from the left-hand side menu. Select Fragments and filter by using the drop-down menu on the right-hand side of the page in order to find the dashboard you require. Clicking on it will take you to the Fragment Detail page, at the bottom of which you can find the code to be used in the dashboard screens.
An example code snippet for the fragment in the first section of this chapter is:
${dashboard.report(request,'carriage_state', 'right')}
From that page you can also navigate to the Fragment Configuration page by clicking on the Edit (pencil) icon at the top right-hand corner of the page, shown below.
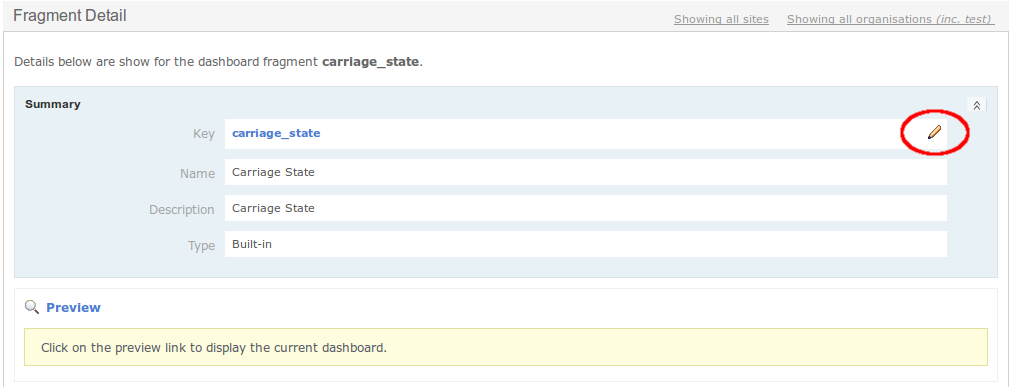
Once in the Fragment Configuration page, you can edit all properties of the dashboard fragment. The Report properties menu is identical to the one for custom and overriden reports. However, one major difference here is the Format of the report, which for dashboards fragments must be text.
Fragment Design
To view the design of the report, click on the Preview (magnifying glass) icon on the right-hand corner of the Report designs menu:
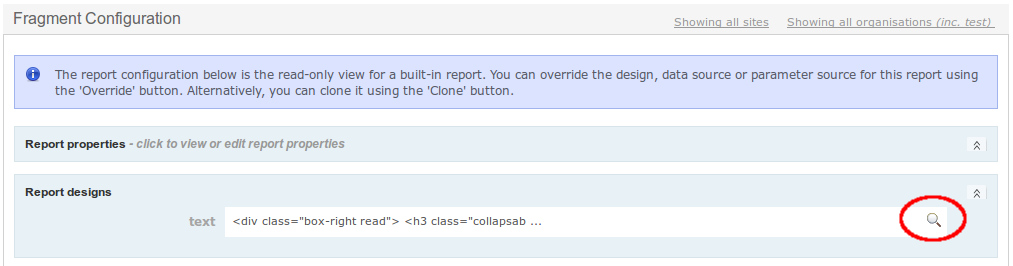
Note that the design for a dashboard fragment is based on a combination of HTML markup and FreeMarker templating elements. An example of design is shown below:
<div class="box-right read">

<h3 class="collapsable"><a href="#">Outstanding shipments by courier state <span>- click to view</span></a></h3>

<#if results?size gt 0>

<dl class = "half">
<#list results as result>
    <#assign courierState=helper.makeLegible(result.courierState!'None')/>
    <dt>${courierState}</dt>
    <dd>${result.shipmentCount}

    <a title="Search for shipments in courier state '${courierState}'"
        href="${contextPath}/despatch/courier/shipment/searchnew.htm?courierState=${result.courierState!''}" class="floatRight">
    <img src="${contextPath}/icons/inspect.gif">
    </a>

    </dd>
</#list>

<#else>

<div class="info message">
There are no outstanding shipments on the system.
</div>

</#if>

<!--[age]-->

</div>
You can preview the fragment by going back to the Fragment Detail page and clicking on Preview, located just below the Summary.
Data Providers
When working with dashboards, the manner in which data is retrieved is determined by it is useful how to use different data provider classes.
The data providers below are the main data providers used in custom SQL-based dashboards.
| Name | Usage |
|---|---|
SqlDataProvider |
Display a single list of rows |
MapResultDataProvider |
Display just the named column values for a single row of data |
MultipleSqlDataProvider |
Allow multiple queries to be referenced in a single report |
All of the providers above refer to Java class names for classes in the package rtd.reports.dataprovider.
For example, the fully qualified name for SqlDataProvider is rtd.reports.dataprovider.SqlDataProvider.
Note that it is also possible for data providers to use functionality built-in to the system, but these data providers are typically not used in custom dashboards created by customer technical users or OrderFlow support staff.
SQLDataProvider
This data provider is used with SQL queries which return a list of rows from the database.
For example, the following SQL can be used to return the 10 orders most recently added to the system:
select externalReference, invoiceContactName from order_item order by id desc limit 10;
The FreeMarker markup which would be used to display the results of this report on a dashboard is shown below:
<#list results as result>
<p>${result.externalReference} ordered by ${result.invoiceContactName!'Unknown'}</p>
</#list>
A note on null values
Note the syntax ${result.invoiceContactName!'Unknown'} allows for the value 'Unknown' to be used if the underlying value is null. FreeMarker is not very forgiving with null values; it will not allow the syntax
${result.invoiceContactName} to be used if the underlying data is null.
If no substitue value is required, then the syntax ${result.invoiceContactName!''} can be used.
Alternatively, the underlying SQL can ensure that a non-null value is returned
using a function call such as ifnull(invoiceContactName,'Unknown').
MapResultDataProvider
This data provider is used with SQL which simply return a single row of data.
For example, the following SQL will give a count of shipments created in the last day by line count:
select
count(id) allShipments,
sum(if(shipment.multiLine,0,1)) singles,
sum(if(shipment.multiLine,1,0)) multis
from shipment
where created >= date(now());
Note that the query above will return a single row of data, as in the table below:
| allShipments | singles | multis |
|---|---|---|
| 115 | 84 | 31 |
When MapResultDataProvider is used, the results can be referenced in the following way:
<p>All Shipments: ${result.allShipments}</p>
<p>Single Line Shipments: ${result.singles}</p>
<p>Multiline Shipments: ${result.multis}</p>
MultipleSqlDataProvider
In some more complicated scenarios, it is useful to have the results of multiple SQL queries providing the data for a single
dashboard fragment. For these situations, the MultipleSqlDataProvider data provider can be used.
An example data source value for this data provider might be the following:
all_open_orders:
select count(id) count from order_item where completed is null;

open_orders_by_channel:
select
channel.name channel,
count(orderItem.id) count
from order_item orderItem
join channel channel on orderItem.channelId = channel.id
where orderItem.completed is null
group by channel.id
order by channel.name;
The data returned from these queries can be displayed using the following:
<#assign allOpenOrders=results.all_open_orders[0]/>
<#assign openOrdersByChannel=results.open_orders_by_channel/>

<p>All Open Orders: ${allOpenOrders.count}</p>

<#list openOrdersByChannel as result>
<p>${result.channel} orders: ${result.count}</p>
</#list>
Notice that the results of all of the queries are grouped in a map called results, which allows
the results of an individual report to be referenced using the syntax results.identifier.
Notice also how the identifier is defined using the identifier: syntax in the data source
in the line prior to the associated SQL for that report identifier.
Macros
Unlike the example, described above, it is sometimes the case that macros are used in dashboard fragments. Macros (short for macroinstruction) are essentially rules that specify how a certain input should be mapped to a replacement output. A set of macros are available to make the task of using certain data in dashboard fragments less repetitive and easier to access.
Some of the more frequently used macros include:
| Name | Parameters |
|---|---|
dateTime |
Displays date and time in locale-aware format. |
dateOnly |
Displays date only in locale-aware format. |
icon |
Used to display a named icon on the system. |
A Note on Product Display
For different environments it is useful to display products in slightly different ways. For example, if the product external reference is a human readable SKU
known to operators, then it is appropriate to use the product externalReference to represent products. However, if the product external reference is a
system generated value without any obvious meaning, then the description might be more appropriate.
Similarly, when quantities need to be displayed, the system can be helpful in ensuring that the correct quantity type (e.g. units, weight, volume) is displayed, with the correct unit of measure.
The dashboards accommodate this using a set of macros, which are helpful in displaying products.
| Name | Parameters |
|---|---|
productTitle |
Displays product title, applying configuration to determine whether this should be the SKU, the product description, or a combination of both. |
displayQuantityAndUnits |
Provides a formatted display of quantity together with they quantity units. |
initialiseProductMap |
Called just before iterating through a list of products in which the productTitle and displayQuantityAndUnits macros are used. |
An example usage of these macros is shown below:
<table>
<thead>
    <tr>
       <th width="50%">Reference</th>
       <th width="25%" class="integer">Quantity</th>
    </tr>
</thead>

<tbody>
<@initialiseProductMap results=results productIdIdentifier="id"/>
<#list results as result>
    <tr>
    <td><@productTitle reference=result.reference description=result.description parameters=parameters/></td>
    <td class="integer">
    <@displayQuantityAndUnits productId=result.id quantity=result.count/>
    </td>
    </tr>
</#list>
</tbody>
</table>
Note that the initialiseProductMap macro is used to efficiently pull back to necessary configuration and data to apply the configured strategy
for displaying product titles and quantities.
Note that for custom dashboards that needs to work in only one environment, a simpler approach will suffice, where the product title can be displayed using
either ${product.externalReference} or ${product.description}, as the situation requires.
Dashboard Screens
Dashboard screens are essentially a group of dashboard fragments, displayed in a way that is most suitable for the user(s). Below is an example of a built-in dashboard screen with four fragments:
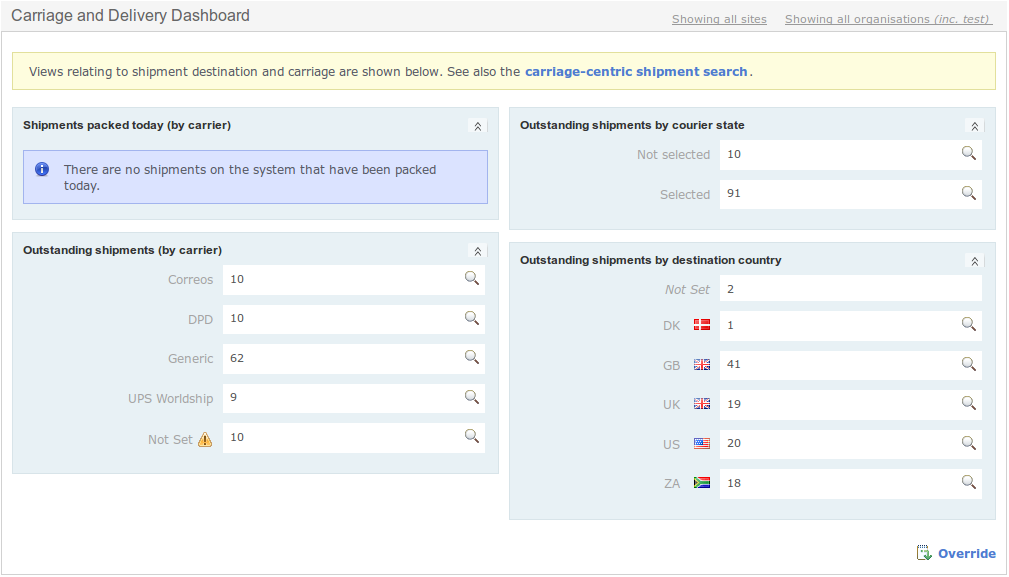
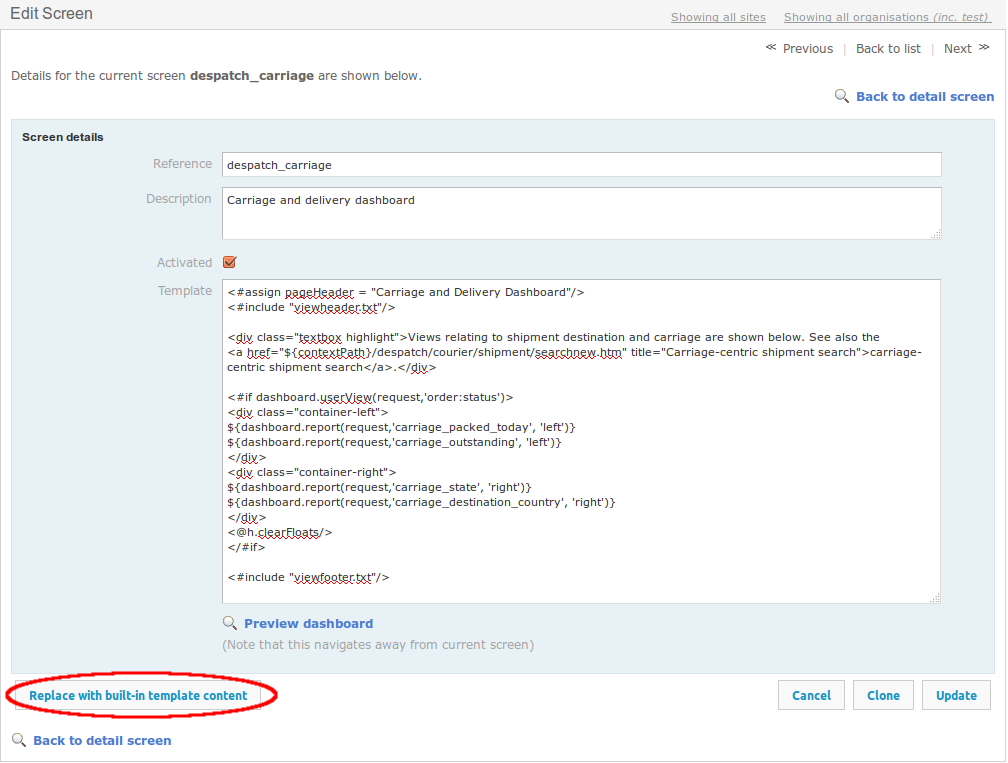
Any dashboard screen can be edited by clicking on the Override link at the bottom right-hand corner of it. This leads to the Screen details page, where you can see all properties of the dashboard. Clicking on Edit dashboard screen takes you to the Edit Screen page, where these properties can be edited.
The Template defines how the dashboard screen is structured. Below is an example of such a template:
<#assign pageHeader = "Carriage and Delivery Dashboard"/>
<#include "viewheader.txt"/>

<div class="textbox highlight">Views relating to shipment destination and carriage are shown below. See also the
<a href="${contextPath}/despatch/courier/shipment/searchnew.htm" title="Carriage-centric shipment search">
    carriage-centric shipment search
</a>.</div>

<#if dashboard.userView(request,'order:status')>
<div class="container-left">
${dashboard.report(request,'carriage_packed_today', 'left')}
${dashboard.report(request,'carriage_outstanding', 'left')}
</div>
<div class="container-right">
${dashboard.report(request,'carriage_state', 'right')}
${dashboard.report(request,'carriage_destination_country', 'right')}
</div>
<@h.clearFloats/>
</#if>

<#include "viewfooter.txt"/>
The parameters of the dashboard views are:
- request, which is a constant parameter, required to encapsulate the data
- view reference, where dashboard views essentially restrict access to certain dashboard fragments, so they are visible only to specific roles
The parameters of the dashboard fragments are as follows:
- request, which is a constant parameter, required to encapsulate the data
- name of fragment, where the name is defined upon the creation of the dashboard fragment.
- position, which can be:
left,rightorfull. As the names suggest,leftandrightdisplay the fragment in the respective half of the screen andfulltakes up the whole width - for fragments, which require more space to be displayed. - parameters (optional), which are usually parsed in to apply filters. They follow the format
name=value;, for example:ignoreEmpty=true;maxAge=10 - an optional boolean to control the exposure of helper methods available to the fragment (advanced use).
Should you need to go back to the default template of a built-in dashboard, this can be done from the Edit Screen page:
However, this is only possible for built-in dashboard screens, so make sure you have a back-up of your custom dashboard templates before editing them - in case you want to go back to the previous version.
Dashboard Views
Dashboard views allow elements from within a dashboard screen to be exposed to users with different sets or roles, i.e. set restrictions on the visibility of views or groupings of dashboard elements.
Views can easily be edited by simply clicking on one when in the Views page - to navigate there, click on the Reports tab on the top, then Dashboards from the left-hand side menu and its submenu - Views. From there you can assign which roles have access to that particular view.
Similarly, when creating a new view (once in the Views page, click on the New View button at the bottom of the page), other than the view reference and description, you can set the visibility of the view to different roles simply by ticking (or unticking) the respective box.
Dashboard Caching
For performance reasons, most dashboard fragments are cached. Caching is the mechanism of temporarily storing computed data, so that future requests for that data can be served faster. This frees the system from having to recompute the data with every request, which is comparatively slower and more demanding in terms of system resources.
For most dashboard fragments, users are adequately served by a display of information which may be a few seconds old, rather than absolutely up to date in real time. However, for certain items of information it is essential to display the latest data data, so cacheing is not required.
When refreshing a page, a cached fragment will display how old the information is in its bottom right-hand corner:

By default dashboard fragments are cached for up to 90 seconds, at which point the data is computed again. However, if required, caching time can be changed for particular fragments by editing their to the maxAge desired amount of seconds. Also, the data can be manually recomputed by clicking on the refresh icon.
The following age escape sequence adds the refresh link to any dashboard fragment:
<div class="${boxClass!'box'} bordered">

... //fragments

<!--[age]-->

</div>